
Monitoring HVAC Performance with Data Loggers onset ® onsetcomp.com HOBO ® Data
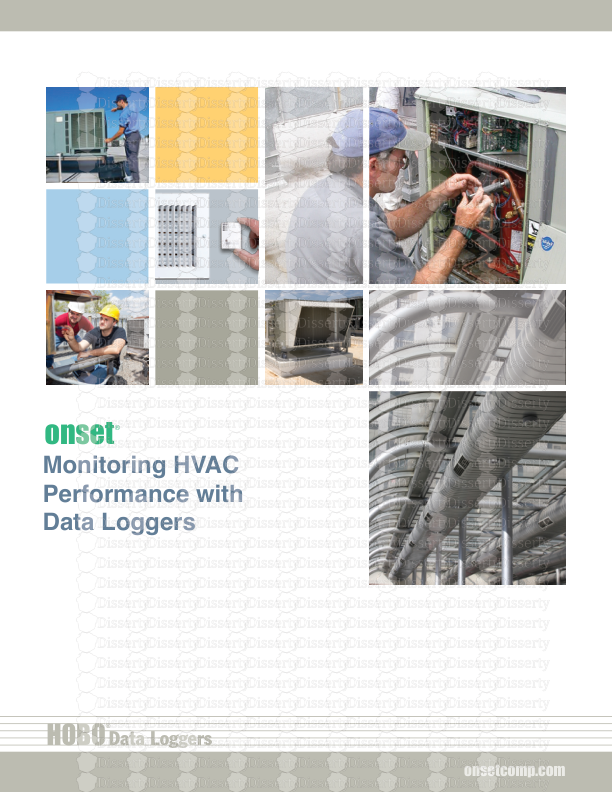
Monitoring HVAC Performance with Data Loggers onset ® onsetcomp.com HOBO ® Data Loggers www.onsetcomp.com onset® Monitoring HVAC Performance with Data Loggers INTRODUCTION 2 Comfort and Indoor Environmental Quality Assessment: People First 3 Comfort 3 Indoor Air Quality 6 HVAC SYSTEM DIAGNOSTICS: FINDING PROBLEMS AND SAVING ENERGY THROUGH RETROCOMMISSIONING 8 Equipment Runtime 9 Compressor Short-Cycling 10 Stuck Dampers And Poorly Functioning Economizers 11 Supply Air Temperature Not Optimized 13 TYPES OF DATA LOGGERS 15 Standalone Data Loggers 15 Web-based Data Logger Systems 15 Wireless Sensor Networks 15 CHOOSING DATA LOGGERS 16 Measurement Accuracy 16 Software and Ease of Configuration 16 Battery life 17 Memory 17 Cost of Ownership 17 Product Support 18 RESOURCES 19 Monitoring HVAC Performance with Data Loggers 1-800-LOGGERS 2 Monitoring HVAC Performance with Data Loggers www.onsetcomp.com onset® Introduction Building operators and managers have the difficult job of providing comfortable working conditions and coaxing aging mechanical equipment to operate at peak performance while minimizing energy costs. If the mechanical equipment is old or has inadequate controls, maintaining comfort at a reasonable cost may prove difficult or impossible. Although energy costs typically represent only 1% of a building’s operating expense when occupant salaries are included, they are easily managed expenses. Energy cost savings flow directly to the bottom line as increased profits. In many areas, utility companies and state governments provide incentives for energy efficiency upgrades that reduce operating costs and often improve comfort. Federal tax incentives are also available for commercial building improvements. Identifying opportunities and verifying savings from self-implemented efficiency upgrades remains a challenge for those with limited resources and experience. Increasingly, building owners are seeking Leadership In Energy And Environmental Design (LEED) designation for their buildings; certification requires meeting specific energy use and indoor environmental quality targets that improve comfort and reduce operating costs, while adding value to the building. All of these goals have a common theme: one must understand how a building and its systems are operating. Data loggers provide unbiased evidence of system operations - good and bad. They can help locate the source of comfort problems, diagnose HVAC equipment operation, identify potential energy efficiency upgrades, verify savings, and contribute to achieving LEED certification. This guide provides an introduction to assessing and diagnosing common comfort, environmental quality, and mechanical problems. onset® Monitoring HVAC Performance with Data Loggers 3 1-800-LOGGERS onset® Comfort and Indoor Environmental Quality Assessment: People First People spend most of their lives indoors and expect buildings to provide comfortable conditions under all circumstances. The purpose of an HVAC system is to maintain the space temperature within a set range, control humidity, and provide fresh air. Comfort Results of scientific studies quantifying comfort will come as no surprise to anyone charged with operating a building: you cannot please everyone. Even in conditions where most people are comfortable, up to 20% of the population may still be too hot or cold. People vary in their desired comfort range depending on age, gender, activity level, and clothing. The American Society of Heating, Refrigeration, and Air Conditioning Engineers (ASHRAE) conducted research that led to Standard 55: Thermal Environmental Conditions for Human Occupancy. Standard 55 describes how to assess comfort from specific measurements and predict when most people will be comfortable. One of the primary factors affecting comfort is occupant dress. Clothing provides insulation; people wearing more clothing are comfortable at cooler temperatures. ASHRAE defines the insulating properties of clothing in units of “clo,” where a man’s suit with jacket has a clo value of 1; a woman’s knee-length skirt, short sleeve top, and sandals has a clo value of 0.5. Another factor affecting comfort is physical activity. “Met” defines units of metabolic activity; a sedentary office worker expends about 1 met, while someone at the gym may be exerting 3 to 5 mets. Knowing how people are dressed and how active they are is necessary to understanding whether they will be comfortable within a specific temperature and humidity range. “It’s not the heat, it’s the humidity” is not just a cliché; it’s the truth. Humans rely on evaporative cooling – sweating – to maintain comfort. People feel cooler in dry conditions because of the enhanced evaporation. Excessive humidity is perceived as being uncomfortable, either “clammy” when cool or “sticky” when hot. This is why measuring relative humidity is critical when evaluating space comfort. ASHRAE Standard 55 describes how to assess comfort from specific measurements and predict when people will be comfortable. 4 Monitoring HVAC Performance with Data Loggers www.onsetcomp.com onset® According to Standard 55, temperatures of 71°F to 78°F at very dry conditions should satisfy 80% of a sedentary population wearing 1 clo. This temperature range drops to 68°F to 75°F when the relative humidity is in the 70% to 80% range. For people wearing 0.5 clo, the acceptable temperature range is about 5°F higher. Onset’s HOBO U12-011 data loggers provide concurrent temperature and relative humidity measurements needed to evaluate whether space conditions will be considered comfortable. If space conditions – based on temperature and humidity measurements – can be considered comfortable, but complaints persist, it should be investigated whether the temperature and humidity are appropriate for the clothing being worn. People dressed for the outdoors will be uncomfortable in conditions suitable for 1 clo. Data loggers provide time-based information that can indicate whether a zone is recovering from thermostat setback or setup at the beginning of the day, or experiencing solar gain in the afternoons. If conditions are out-of-bounds for a few hours or only at specific locations, then corrective steps become obvious. Reprogramming thermostats, adding window shading, or balancing airflow are possible solutions. ASHRAE Standard 55-2004 defines the range of temperature and humidity conditions at which 80% of the occupants will be comfortable, assuming sedentary activity. The red region is the comfort zone for 1 clo; the blue region for 0.5 clo. The zones tilt to the left because people are comfortable at cooler temperatures when the humidity is higher, an effect of evaporative cooling from the skin. When evaluating a space for comfort, use a data logger that records air temperature and relative humidity in 15-minute intervals and compare the results to the Standard 55 comfort chart. When placing data loggers, consider the following factors: The HOBO U12-011 Temperature Data Logger is a sitandalone logger for high-accuracy temperature and humidity monitoring. Monitoring HVAC Performance with Data Loggers 5 1-800-LOGGERS onset® Increasing airflow to the space can significantly reduce stratification. If the air handlers or rooftop unit cannot be adjusted, ceiling fans may be an option. • At least one data logger should be located in the center of the room or space; additional loggers should be located 3 feet from the largest window and in other areas expected to have high or low temperatures. Usually only one humidity measurement is necessary. • Windows affect local temperatures. Solar gain causes localized heating; cold outdoor temperatures cause radiant cooling. Measure temperatures near problem areas. • If the thermostat is not in the center of the room, place a data logger next to the thermostat to ensure that it is working correctly. • Place an external temperature sensor in the supply air register to measure the delivered air temperature. ASHRAE Standard 55 defines measurement locations (relative to the floor) when evaluating a space for temperature stratification, another factor that affects the perception of comfort. Warm air rises and most spaces will experience some level of stratification. Small temperature differences between head and foot are acceptable, but a temperature difference of 6ºF between head and foot would be uncomfortable to 40% of the population. Having the thermostat at the correct height and providing sufficient air motion to reduce stratification are important to maintain comfortable conditions. In addition to its integrated temperature and relative humidity sensors, multi-channel data loggers such as Onset’s HOBO U12-013 have provisions for two external probes that can measure temperatures near the floor and the ceiling in order to determine the extent of stratification. Increasing airflow to the space can significantly reduce stratification. If the air handlers or rooftop unit cannot be adjusted, ceiling fans may be an option. Even a slow-moving ceiling fan can provide enough mixing action to reduce stratification – a strategy especially effective in high-bay areas. In extreme cases, cooling systems can “dump” cold air on the occupants below – a severe case of reverse stratification. Ceiling-mounted diffusers are designed to move cool air along the ceiling where it mixes with warmer room air. If the supply air is too cold relative to its discharge velocity, the cold air may fall to the floor before mixing fully. Ceiling registers with perforated metal grills may be especially susceptible to this problem because they do not provide adequate velocity along the ceiling. The mathematics behind this phenomenon is quite involved, but it is sufficient to say that if such a condition exists, it will be readily apparent. Deploying a HOBO U12-013 with an external temperature sensor in the diffuser can track the supply air temperature to see if it drops below 55°F. uploads/Management/ hvac-guide 1 .pdf
Documents similaires


-
71
-
0
-
0
Licence et utilisation
Gratuit pour un usage personnel Attribution requise- Détails
- Publié le Fev 22, 2021
- Catégorie Management
- Langue French
- Taille du fichier 4.9359MB